With so many memory areas of SAP HANA, What should I really Monitor with respect to Memory usage of HANA database?
Below picture is key in understanding the memory allocation sequence.
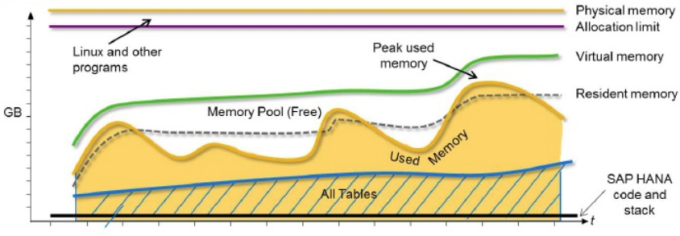
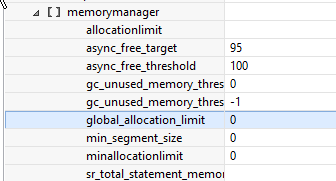
You can control the behaviour of total memory allocated to SAP HANA database by using allocation limit parameter (global.ini -> memorymanager -> global_allocation_limit)
Unless you have additional software running on the HANA server or the HANA licensed memory is less than you physical memory, global_allocation_limit need not be set.
Default value is 0 and most of the times this is not set assuming that the server will be only used by HANA database. This means HANA DB can use the complete memory of the server.
Memory allocation in HANA Database implements a pool concept. That is, memory is pre-allocated (reserved) from the operating system for performance reasons. By default, the HANA database will allocate up to approximately 90% of the available physical memory.
This will be used for queries that will need additional space at once. This will be RESERVED and not released back to Operating System.
Hence the reserved memory does not indicate any memory issues with the database.
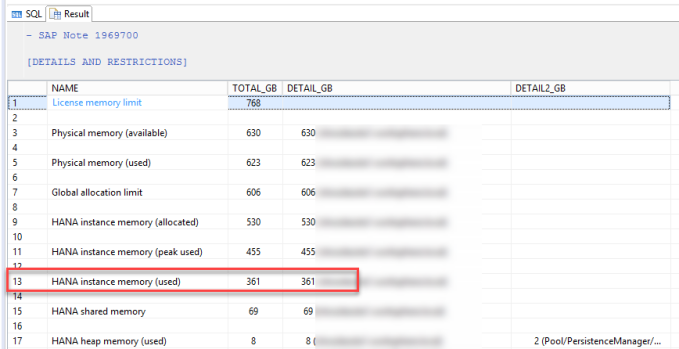
Key figure to be monitored is the active memory usage of the HANA database:
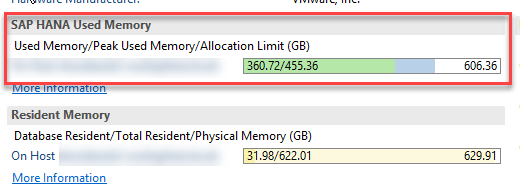
Same has been clarified in below SAP Note:
2081473 – HANA Resident Memory : High Memory Usage
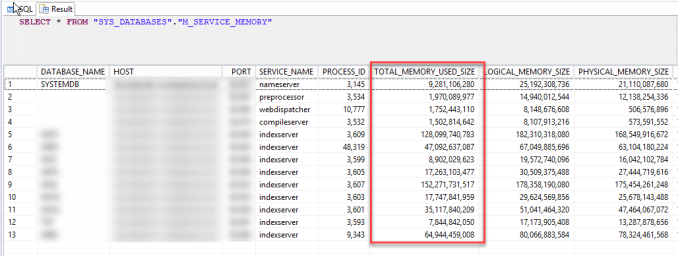
You can monitor the current usage of memory by each tenant by using below query:
SELECT * FROM “SYS_DATABASES”.”M_SERVICE_MEMORY”
Total memory usage of the whole database can also be monitored with HANA_MEMORY_OVRVIEW (SAP Note 1969700 ).
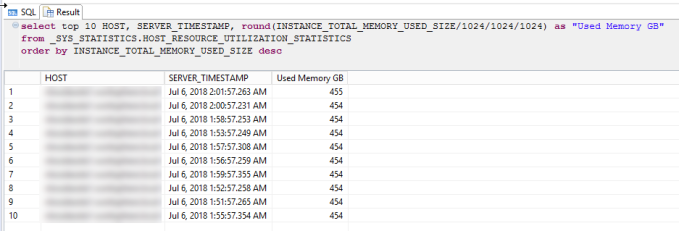
You can also monitor the history of total memory usage using _SYS_STATISTICS, like example below:
To check if the SAP HANA Memory parameters are set optimally, you can use HANA_Configuration_Parameters_1.00.70+ (SAP Note 1969700).
Important SAP Notes:
